If you live in Western Mass, you already know the year doesn’t “average out.” February is not a smaller version of July. The sun sits lower. Days are short. Snow shows up when it feels like it. And your electric use often goes the opposite direction, especially if you’ve got heat pumps, an EV, a workshop, or a farm operation that doesn’t shut down for winter.
That’s why Seasonal Solar Generation matters. It helps to think about solar production seasonally, not just as one annual number.
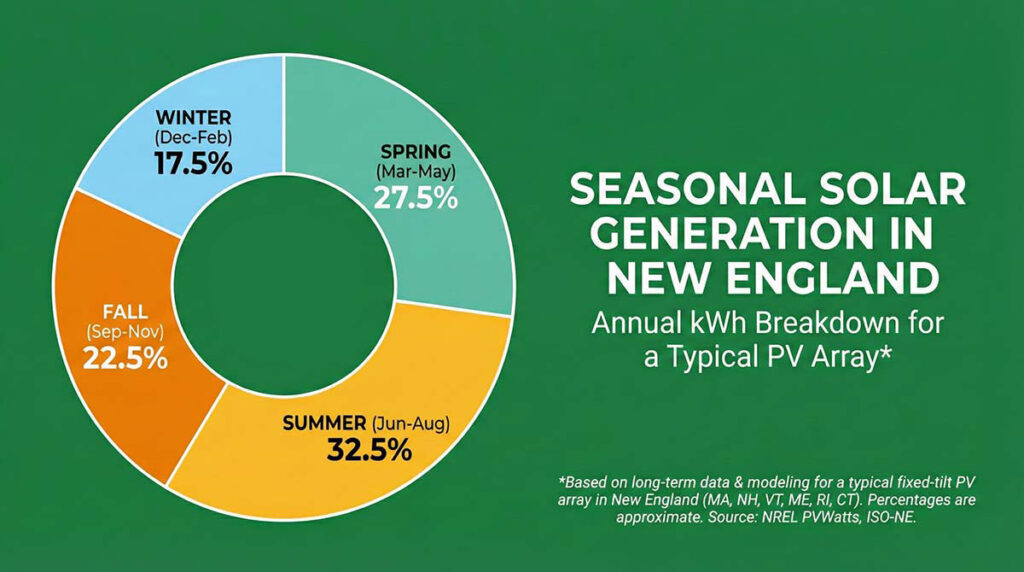
Here’s the seasonal split we use as a realistic New England baseline for a typical fixed-tilt PV array, based on long-term modeling and regional datasets:
-
Winter (Dec–Feb): 17.5%
-
Spring (Mar–May): 27.5%
-
Summer (Jun–Aug): 32.5%
-
Fall (Sep–Nov): 22.5%
The value isn’t that these numbers are “perfect.” The value is that they’re close enough to plan around, and they match what homeowners usually see once a system has a full year under its belt.
Why the Seasons Swing So Hard Here
Most people assume cold weather is the main reason winter production drops. Temperature matters, but it’s not the headline.
In New England, the bigger drivers are:
-
Day length and sun angle (winter sun is lower and days are shorter)
-
Snow and “soft shading” (snow cover, grime, and long winter shadows)
-
Cloud patterns and storm cycles (weeks of muted skies aren’t unusual)
Spring is the sleeper season
Spring often outperforms people’s expectations. Days get longer quickly, the sun climbs higher, panels shed winter buildup, and cooler temperatures can actually help module efficiency. Depending on the site, spring can rival or even beat summer for total kWh.
Seasonal Solar Generation: The Rule of Thumb That Helps Set Expectations
If you want one quick mental model:
-
A strong summer month in New England often produces about 1.8–2.2× the energy of a dark winter month on the same system.
That matches what many homeowners notice in their monitoring apps. You’re not “losing efficiency” in winter. You’re living at a different part of the solar calendar.

What the Seasonal Percentages Look Like in Real kWh
A common PVWatts-style yield for southern New England is roughly 1,200 kWh per kW per year for a well-sited, fixed-tilt system.
So let’s make it tangible.
Example: A 10 kW system producing about 12,000 kWh per year
(That’s 1,200 kWh per kW × 10 kW.)
-
Winter (17.5%): 12,000 × 0.175 = 2,100 kWh total (about 700 kWh/month)
-
Spring (27.5%): 12,000 × 0.275 = 3,300 kWh total (about 1,100 kWh/month)
-
Summer (32.5%): 12,000 × 0.325 = 3,900 kWh total (about 1,300 kWh/month)
-
Fall (22.5%): 12,000 × 0.225 = 2,700 kWh total (about 900 kWh/month)
That’s the seasonal rhythm most people feel:
-
Summer is the workhorse
-
Spring is surprisingly strong
-
Fall is steady
-
Winter is the “hold tight” season
If your system is smaller or larger, you don’t need new math. You just scale it:
-
Estimate annual production (kW × ~1,200 kWh/kW/year as a baseline)
-
Apply the seasonal percentages to get a realistic breakdown

Winter: 17.5% (Dec–Feb)
Winter production being lower doesn’t mean solar “doesn’t work” here. It means you’re getting a smaller share of your annual output during the exact months when many households use the most electricity.
What it feels like in real life
Two practical takeaways:
-
Winter is where system design choices show up.
Tilt, orientation, shading, and snow-shedding matter more in winter than any other season. If a roof plane is already a little compromised, winter is when it really underperforms. -
Winter is where expectations need to be honest.
A typical modeled breakdown puts winter around 50–60% of an “average month.” So if you’re staring at your monitoring app in January thinking, “That seems low,” it probably is low… and still normal.
If your goal is winter resilience (not just annual savings), that’s where storage and load planning come into play. Solar can’t create sunlight. What it can do is reduce annual costs and give you more control, especially when paired with batteries and load management.

Spring: 27.5% (Mar–May)
Spring is the “why didn’t anyone tell me this?” season.
Production climbs fast, temperatures stay cool, and panels often spend more time in clear sun than they do in midsummer haze. Depending on the site, spring can rival or even beat summer for total kWh.
Practical tip: Shift flexible loads into daylight
If you have flexible loads, spring is a great time to move them into the hours when your system is producing strongest:
-
EV charging at home
-
Laundry and dishwashers
-
Dehumidifiers
-
Workshop tools
-
Well pumps or other scheduled loads (where appropriate)
You’re effectively using your own generation instead of exporting it and buying power back later.

Summer: 32.5% (Jun–Aug)
Summer is the biggest slice of the pie, and it’s what makes the annual numbers work.
The nuance most people miss
Heat can slightly reduce panel efficiency. That doesn’t erase summer’s advantage, but it’s why “hotter” doesn’t automatically mean “better” for kWh.
What summer is great for
-
Covering baseline household load during the day
-
Charging EVs efficiently (especially if you can charge at home)
-
Building credits (depending on your utility structure) for the darker months
-
Keeping batteries topped off for backup-ready households
If your house uses more power in summer because of cooling, pool pumps, or a busy household schedule, summer production often meets you right where you are.

Fall: 22.5% (Sep–Nov)
Fall doesn’t get the hype, but it matters. It’s a meaningful chunk of annual production and often feels like the “steady hand” season.
Fall is also when shade shows up again
Trees that weren’t a big deal in June can become a big deal in October, especially late afternoon.
Practical tip: Watch the pattern
Fall is a good time to watch your monitoring and look for repeatable drops. If production falls off sharply at the same time each day, you may be seeing a shade issue that could be addressed with trimming, or considered during a future expansion (or ground mount/canopy planning).
How to Use This Seasonal Breakdown When You’re Planning a System
A lot of solar conversations still get stuck on one question: “How much will it produce?”
A better question is: How does it produce across the year, and how do we want to use that power?
Design for the year, not for January
If you size a system to cover 100% of winter usage, you’ll overshoot the rest of the year for most homes. That might still be a valid choice, but it isn’t the default.
A more common (and usually smarter) approach is:
-
Aim for a strong annual offset
-
Set honest winter expectations
-
Use storage + load planning if winter resilience is the real goal
If winter performance is a priority, talk about structure, not hope
The best winter improvements aren’t marketing tricks. They’re physical realities:
-
Reducing or managing shade
-
Choosing a roof plane with better exposure
-
Considering tilt and layout (within real-world constraints)
-
Looking at a ground mount or canopy where snow shedding and sun access can be better
Pair solar with load planning for real resilience
Batteries don’t magically cover high winter usage on their own. But combined with load management, they can:
-
Cover the circuits you actually care about during outages
-
Help shift solar into evening use during stronger seasons
-
Give you more control over when you buy from the grid
The “So What?” Summary
-
Spring and summer carry the year. That’s normal.
-
Fall is steady and meaningful.
-
Winter is smaller, and it’s supposed to be.
-
The goal isn’t perfect monthly balance. The goal is lower annual cost, more control over your power, and a system that matches how you actually live.
If someone promises flat production all year in New England, that’s not experience talking.